When “my” app stops working on “your” network, and “users” start complaining: who’s the first to get the blame?
It has been this way since I started in IT in 1994. We blamed SNA, then TCP/IP and then DNS and the internet. The network team were always the target for our collective IT ire!
But then I joined Cisco: the Borg! I was now The Network! My new peers would tell this common story.
“The problem for use network engineers is that the network is guilty until proven innocent.
I open up (yet) another ticket that a user has titled, ‘Is the network down?” — the fact that they could create a ticket over the network is lost upon them.
We no longer laugh at the IT Crowd meme, “Have you tried turning it off and on again?” We’re living it. “

In fact, have you heard of MTTIMean Time To Innocence (MTTI) refers to the duration it take… More?
The Mean Time To Innocence (MTTIMean Time To Innocence (MTTI) refers to the duration it take… More) is how long it takes for the networking organization to prove it is not the network causing the degradation. Once that task is accomplished, it is common to assume some other component of IT such as the servers must be at fault.
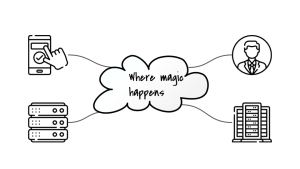
But we must be kind to users. It’s not their fault. They have their own tech stacks to cram into their brains. The network is something not everyone understands.
That’s why networks are drawn on whiteboards as a mysterious cloud: it’s complicated, and “Here’s where the magic happens!”
And it’s only getting worse.
Engineers face new challenges in network performance monitoring when companies move to the cloud.
Network complexity increases because cloud workloads and their underlying infrastructure are dynamic and ephemeral in nature.
Times have changed, and so must NPM: modern NPM has entered the game.

Not every enterprise IT shop will be using these modern IT trends, but for this article we’ll assume we’re talking about one that does use all three.

The big three trends that are forcing enterprises to upgrade their NPM are:
Assuming we are talking about a modern IT shop, what are each of these three trends and how do they impact NPM and require a modern NPM.
Anything that is spread over a network is distributed, one might argue, but some things are more distributed than others.
Beyond the 1990’s client/server architecture, then the internet, then the 3-tier web-app-db stack… by comparison, today’s applications can be hyper-distributed across public clouds, hybrid clouds, multi-clouds and edge CDNs. The reality is: it’s a mix of everything above.
So if the app is “down”, how do we know which part is broken?
How does the network engineer’s NPM tool see across all of these networks, some of which they don’t control? Do they need to use multiple NPMs? Or accept blindness in part of the network?
It’s so easy to add services to the network. And to then delete them. In fact, if you look at containers — ephemeral by nature — you could have hundreds/thousands appearing and disappearing, hidden behind virtual interfaces on a virtual machine in the cloud…
Serverless services take this even further. How do you know what good looks like on your network, if your network is constantly changing because of dynamic, transient, ephemeral services that connect and disconnect all the time?
NPM is no longer just the province of a battered and bruised central networking team.
SREs, Application and cloud engineers… all have the power to create networks. Putting central command-and-control ITSM processes on these people just pushes them to Shadow IT, and they still are on the network.
You are forced to answer the question: “How can we let people go fast within guardrails that are monitored?”
We’ve talked about the problems facing NPM tools, who’s agitated by those problems (everyone) and why it’s getting harder (3 trends): but what about the solution?
The 7 features of a modern NPM tool include:
There is a broad market of dozens of NPM tools, but if you focus on tools that can handle modern distributed, dynamic and democratized IT, then here are two examples that SJULTRA has worked with:
Collecting data is cheap, but not having it when you need it can be expensive, so you should instrument everything, and collect all the useful data you reasonably can. — Datadog
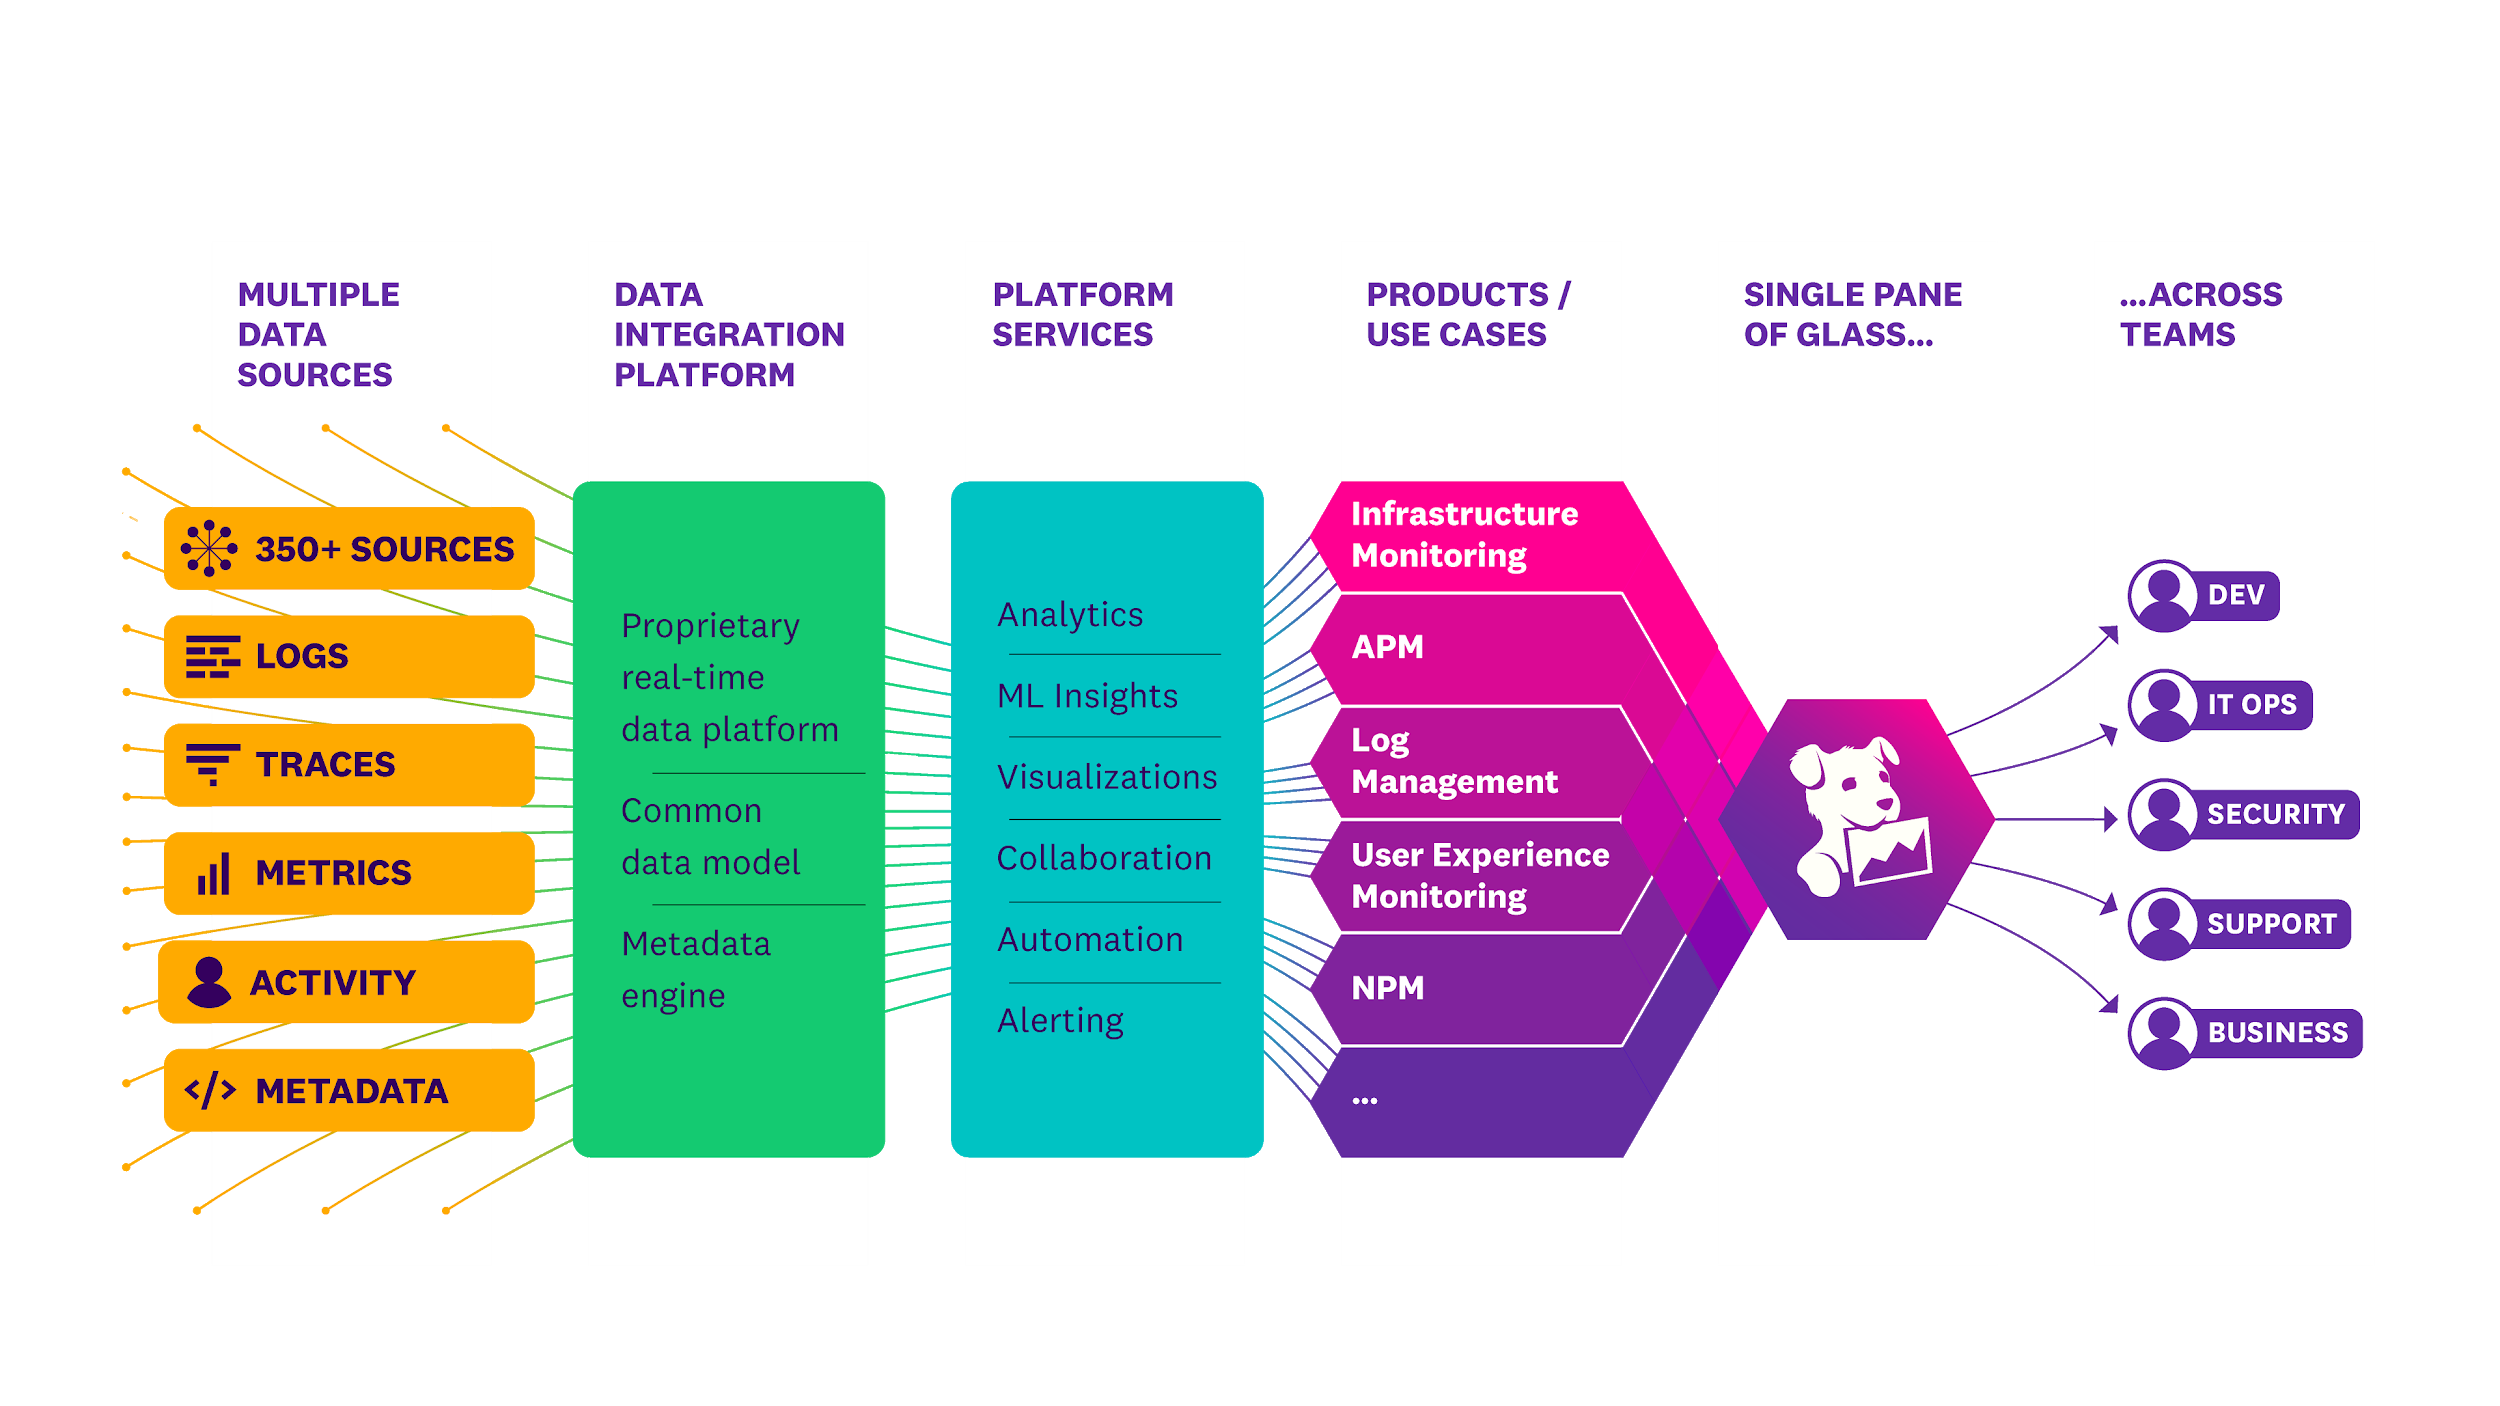
Datadog’s Network Performance Monitoring provides full visibility across the distributed system of network component that makes up your on-premises, cloud, and hybrid environments, with little to no overhead.
But Datadog is not just about the network. ![]()
Datadog handles dynamic services because it unifies network data with infrastructure, application, and user experience data in a single pane of glass. Network Device Monitoring (NDM) autodiscovers devices from a wide range of vendors and lets you drill down to monitor the health of individual devices.
Lastlly, Datadog enables the democratization of NPM because anyone can use it: you don’t have to be a network engineer wearing a propeller hat. Here’s Alex Kanevsky, a Lead Architect:
With Datadog NPM, we can quickly determine if our network is at fault for slow traffic or low connectivity before our applications are affected, so that insuring travel is a seamless experience for our customers.
ALEX KANEVSKY
LEAD ARCHITECT AT GENERALI GLOBAL ASSISTANCE
Datadog provides a unified solution to seamlessly combine the three pillars of observability and enable full visibility across the application stack.
Other than that, the most important thing is the smooth, frictionless integration process with more than 400 built-in integrations and pre-defined dashboard templates for them.
The diagram below compiles what is offered by Datadog.
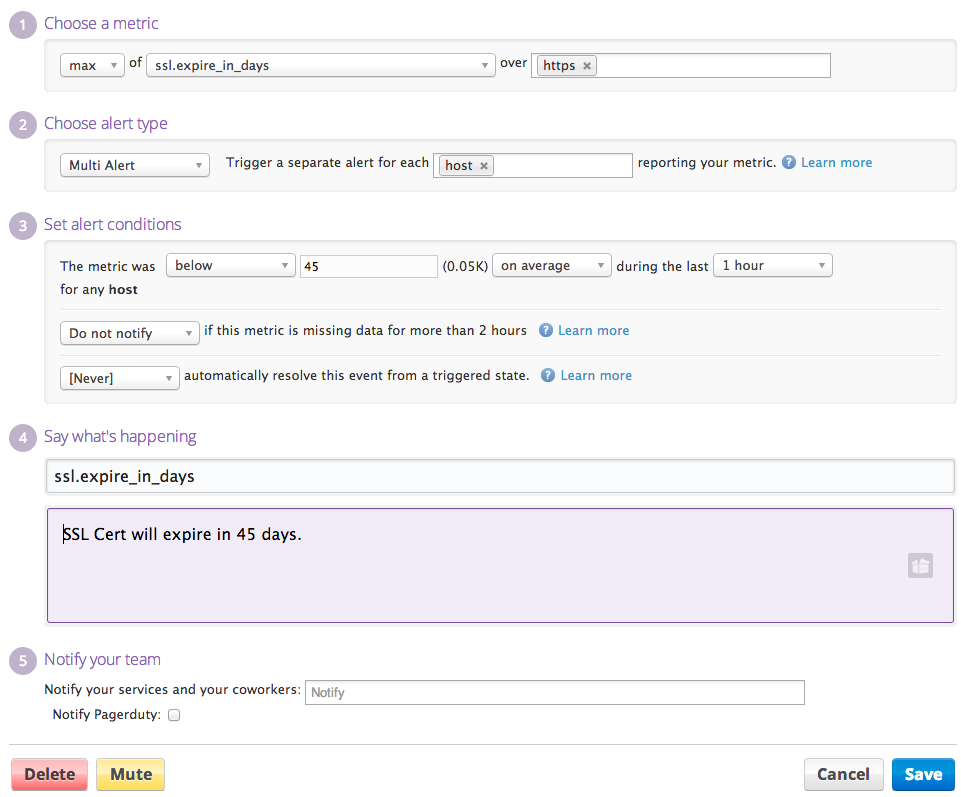
As an example of a simple, super-useful feature, one of the causes of application failures is the expiration of SSL certificates. Because Datadog can analyze everything in the stack then you can set up rules for things that touch the network, infrastructure and applications:
Grafana is a multi-platform open source analytics and interactive visualization web application. It provides charts, graphs, and alerts for the web when connected to supported data sources.
Grafana becomes an NPM by customizing it through mixins, which is the first difference when comparing it to the Datadog’s bundled commercial off-the-shelf (COTS) model.
Here at Grafana Labs, we want to help facilitate the monitoring of those important network devices and provide a few simple ways to get started. Our SNMP mixin is a great baseline for monitoring network devices. A mixin is a configurable, reusable, and extensible package which bundles together Grafana dashboards and Prometheus rules and alerts.
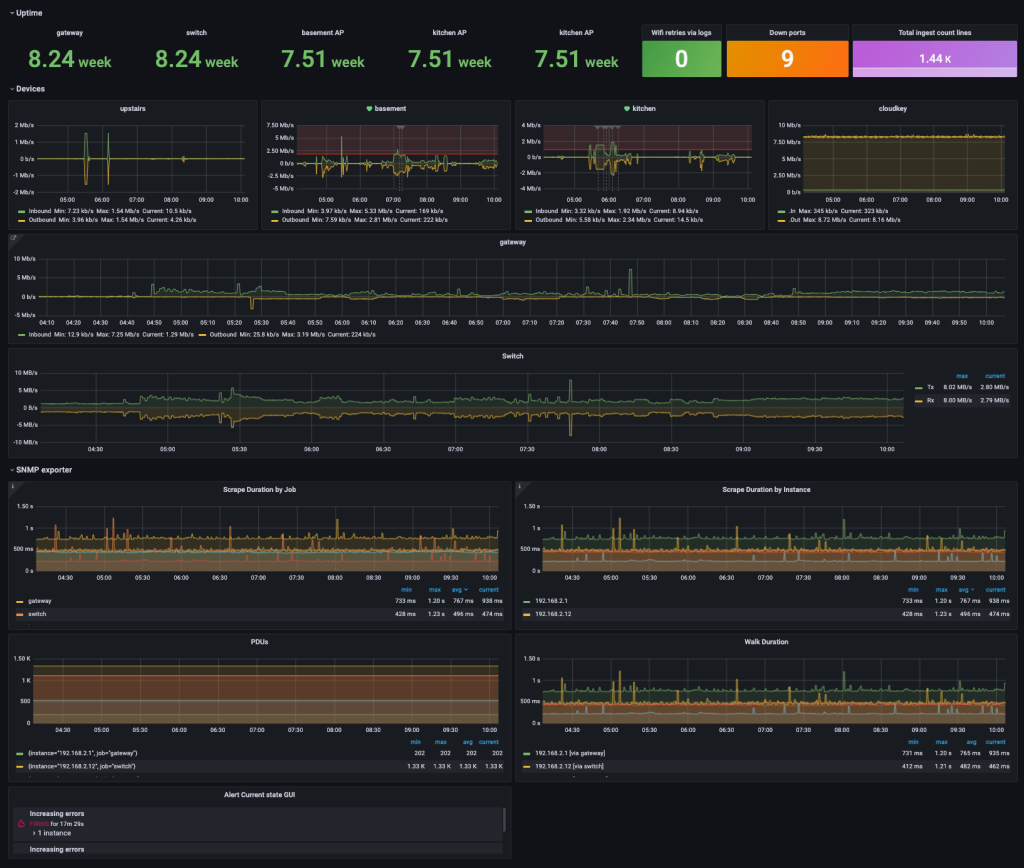
Grafana’s extensibility is what enables it to meet the modern NPM needs for distributed and dynamic services and to democratize access by making the information visual and easy to understand.
SJULTRA is a cloud security consulting firm based in California. Our consulting team works with customers around the world to develop high-impact strategies that drive effective digital business transformation leveraging cloud based technology.
SJULTRA partners with vendors and enterprises to design, build and operate cloud security infrastructure stacks, including Network Performance Monitoring.
One of the offerings that SJULTRA offers is to support cloud security vendors and their enterprise clients to build lab systems before production readiness.